The Housing Health and Safety Rating System has been reformed, and the hazard module has been updated to match. There are now 21 hazards instead of 29, the scoring page has been redesigned, results are shown as a risk band of Low, Medium or High instead of a rating from A to J, and the hazard report has been updated to suit.
The change applies to new inspections only. Your existing inspections keep the 29 hazards and the A to J ratings (before 19 August 2026 or Inspector App update, whichever is latter), and stay open for you to work on with no planned cut-off date. Nothing is migrated, nothing is locked, and nothing is deleted. The two versions run alongside each other, and the system keeps track of which is which so that each inspection shows the right page.
In this guide you'll learn how to:
Understand what is changing, and when Tell an HHSRS1 inspection from an HHSRS2 one Find your way around the 21 hazards Assess a hazard on the new scoring page Read the risk band and category Use the hazard report Filter the CSV reports by hazard and risk band Continue working on your legacy inspections
1. What is changing, and when
The reform changes four things about how a hazard is assessed and reported:
The hazard list. The 29 hazards become 21. The 21 are not simply a shorter list; several of them combine two or more of the old hazards under a new name, and they bring their own deficiencies, remedies and timeframes with them.
How likelihood and harm are scored. Likelihood of harm is still expressed as "1 in N", but you now choose from 16 fixed points on a scale with plain-English descriptors and colour. The four harm outcome classes keep their meaning but are renamed, and are scored as percentages that add up to 100.
How the result reads. The A to J rating is replaced by a risk band of Low, Medium or High, shown with a matching colour. Category 1 and Category 2 are unchanged.
The hazard report. The report sent to the landlord uses the new hazard names and shows the category together with the risk level.
The calculation itself has not changed. The same model works out the score from the likelihood and the harm outcome spread.
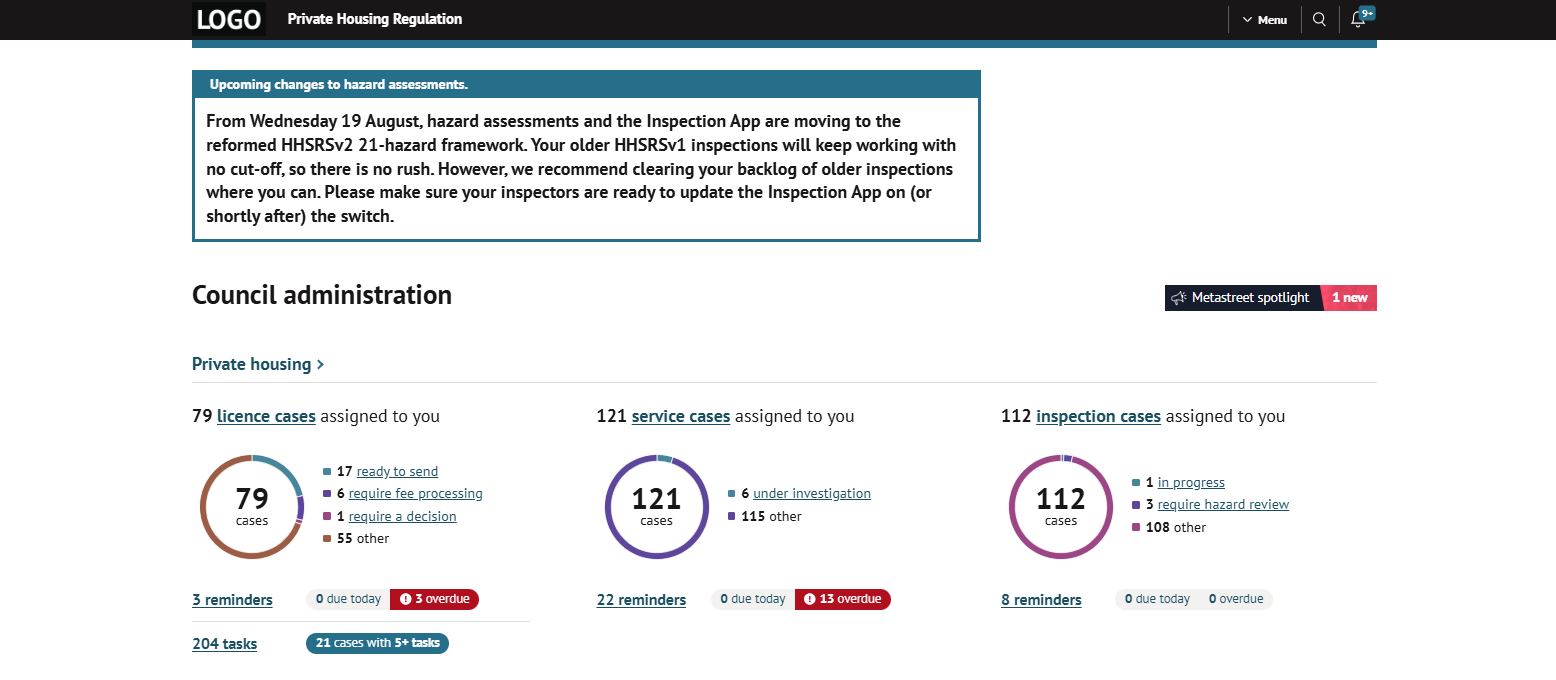
A banner appears at the top of the site ahead of the change, telling you that it is coming. On the go-live date the wording changes to tell you that new inspections now use the 21 hazards, and to recommend that you clear any outstanding legacy work. The banner is a recommendation, not a deadline. It is removed once the transition has settled.
NOTE: Legacy inspections are not affected by the go-live date. You can carry on assessing them afterwards for as long as you need.
2. Telling the two versions apart
Every inspection carries a marker recording which version of the hazard model it was created under. You do not need to set this or think about it. The system reads it and shows you the matching page.
In practice this means:
An inspection created before the change shows the 29 legacy hazards, the old scoring page and an A to J rating. An inspection created after the change shows the 21 HHSRS2 hazards, the new scoring page and a risk band.
You cannot convert an inspection from one version to the other, and a single inspection never mixes the two hazard sets.
3. The 21 hazards
The 21 hazards replace the 29 across the back office and the Inspection App. Inspectors capturing a new inspection see the 21; existing inspections in the app still show the hazards they were created with.
Because several of the new hazards are amalgamations of old ones, a hazard you are used to may now sit under a different name. A few names appear in both the old and the new list, so when you are looking at a list that spans both versions, check which version an entry belongs to before assuming it is the hazard you know. Section 9 covers this for the CSV reports.
4. Assessing a hazard
Open a hazard on an HHSRS2 inspection to reach the new scoring page. The page has the same job as before: you record how likely harm is, and how serious that harm would be, and the system works out the score, the band and the category.
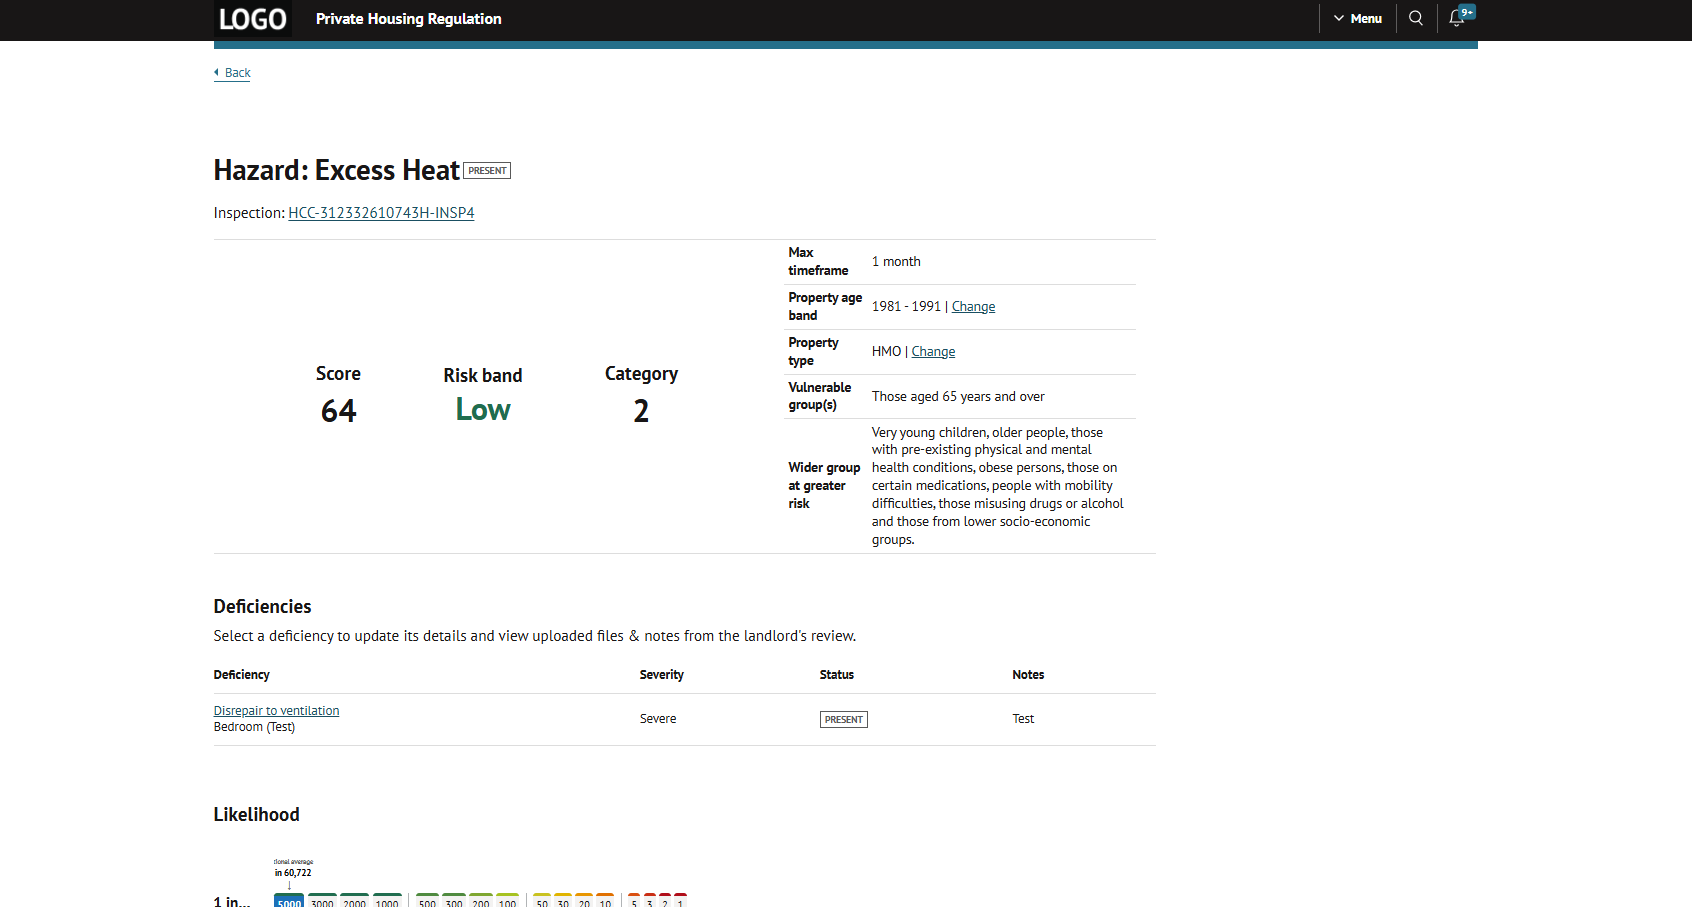
The header
At the top of the page you'll see the score, the risk band and the category, updating as you score.
Two read-only fields have been added beneath: Vulnerable group(s) and Wider group at greater risk. These come from the official guidance for that hazard and are there as a reference while you score. They are not editable, and they do not appear on the hazard report or in the Inspection App.
Likelihood of harm
Likelihood is chosen from 16 fixed points, shown as a scale running from "1 in 5000" at the least likely end to "1 in 1" at the most likely. The points are grouped in fours under four descriptors: Very unlikely, Unlikely, Likely and Very likely. The scale is coloured from green through amber to red so you can see at a glance where your choice sits.
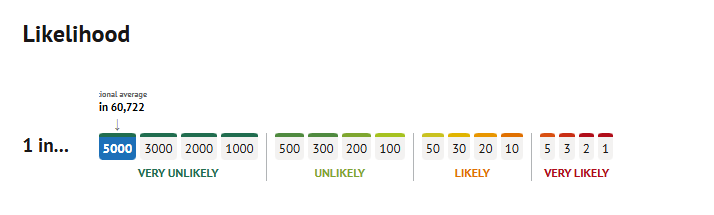
Select the point you want. You cannot enter a value in between; the 16 points are the only options, which matches the reformed guidance.
The national average. The national average likelihood for the property's type and age is available beside the scale as a reference point. The indicator sits level with the average and points at the nearest scale point to it, with the true measured figure shown as a label. Where the true average falls outside the range of the 16 points, the label still shows it even though it is not itself selectable.
Harm outcome
The four harm outcome classes are Extreme, Severe, Serious and Moderate. These replace Class I to Class IV; the numbering has been dropped.
Each class has its own bar with 11 fixed points: 0%, 0.1%, 0.2%, 0.5%, 1%, 2%, 5%, 10%, 20%, 30% and 50%. As with likelihood, the points are grouped under Very unlikely, Unlikely, Likely and Very likely.
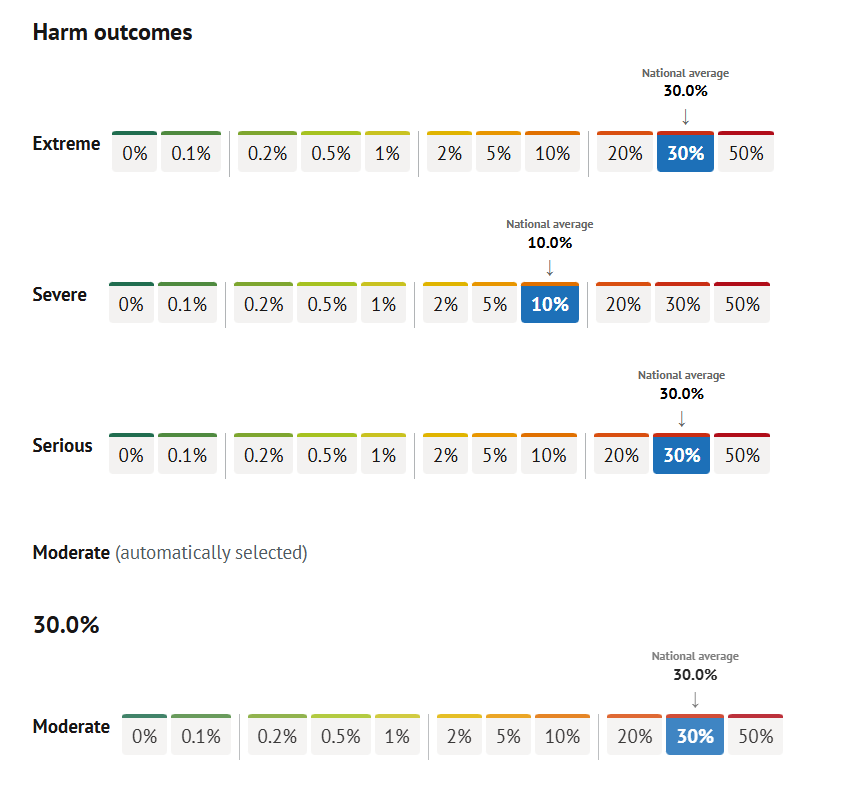
The four must add up to 100. You score three of them and the fourth is worked out for you. For most hazards the automatic one is Moderate, which is shown as non-interactive and labelled 'automatically selected'.
NOTE: Radiation works the other way round. For that hazard you score Moderate, Serious and Severe, and Extreme is the automatic remainder. This follows the official scoring approach for radiation and is the only hazard that behaves this way.
Each bar has its own national average indicator, so you can cross-check your scoring against the average as you go.
If the total goes over 100. If the three classes you score add up to more than 100, the remaining class would be a negative figure. When this happens you'll see an alert and the Save button is disabled until you bring the total back down. Your entries are kept and every field stays editable, so you can adjust rather than start again.
5. Risk bands and categories
The A to J rating is replaced by a risk band. There are three:
High, shown in red Medium, shown in orange Low, shown in green
The category is unchanged and follows from the band:
| Risk band | Category |
|---|---|
| High | Category 1 |
| Medium | Category 2 |
| Low | Category 2 |
On the hazard report this is written out in full as 'Category 1 - High risk', 'Category 2 - Medium risk' or 'Category 2 - Low risk'.
NOTE: The correct term for the middle band is 'medium', not 'moderate'. 'Moderate' is one of the four harm outcome classes and means something different.
6. The inspection overview page
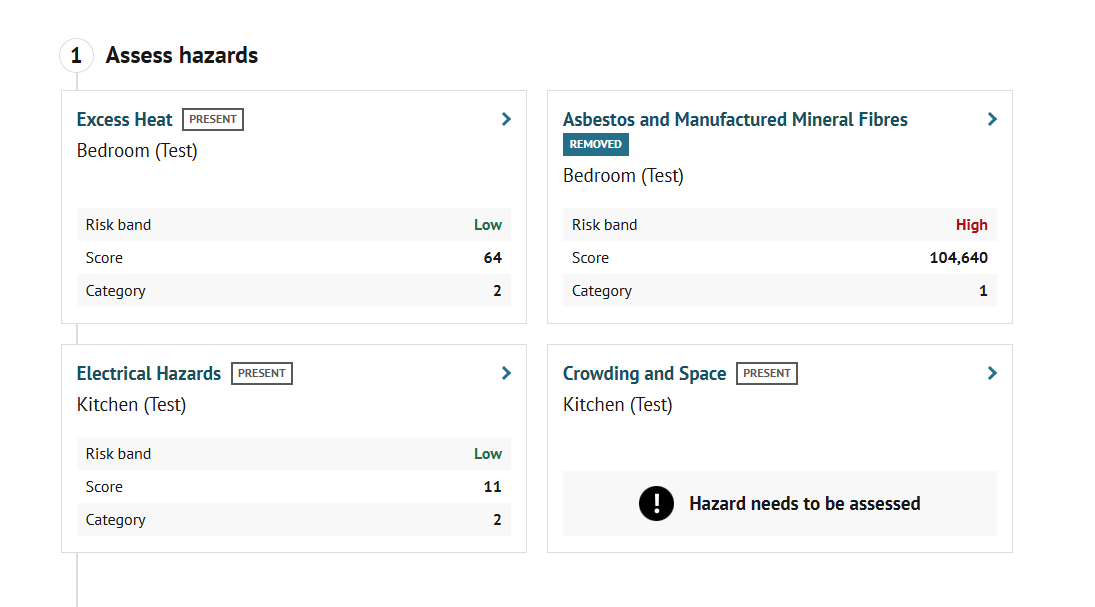
The hazard assessment summary on the inspection overview page follows the version of the inspection.
A legacy inspection keeps the box you are used to, showing the rating from A to J. An HHSRS2 inspection shows the new box, with the risk band in its colour and the category.
7. The hazard report
The hazard report sent to the landlord has been updated for HHSRS2 inspections. It is not a redesign; three things have changed.
Hazard names. The report shows the hazard names from the inspection's own hazard set, so an HHSRS2 report shows the new names.
The 'Risk category' explanation on page 1. The wording in the Notes table has been rewritten to describe assessment under HHSRS2, rather than framing Category 1 as an imminent risk.
The 'Risk category' column on page 2. This now shows the category together with the risk level, for example 'Category 1 - High risk', with the risk level in its matching colour.
Everything else on the report is as it was: the hazard, the deficiency, the location, the remedy and the timeframe.
A single report is always either legacy or HHSRS2. The two are never mixed, and the legacy report is unchanged.
The landlord's side is also unchanged. They follow the same link, see the same information and respond in the same way. Landlords do not see the vulnerable group fields, your scoring, the score, the risk band or the category.
8. Legacy inspections
Your existing inspections carry on as they are.
They keep the 29 hazards they were created with. They keep the A to J rating and the old scoring page. They stay open with no cut-off date, so you can finish them at your own pace. They are never locked, converted or deleted.
Legacy inspections phase out on their own over time, as new ones can no longer be created under the old model. There is no need to rush, although clearing outstanding work is worth doing while it is fresh.
9. CSV reports
The 'Hazards and ratings' report can cover a date range that spans both versions, so a single report may return legacy and HHSRS2 inspections together. Two filters and two columns have changed to suit.
The Hazard filter
The hazard filter is still a single mandatory filter, but the hazards are now split into two sections you can expand and collapse:
HHSRS2 hazards (2026), shown first HHSRS1 hazards (2004), shown second
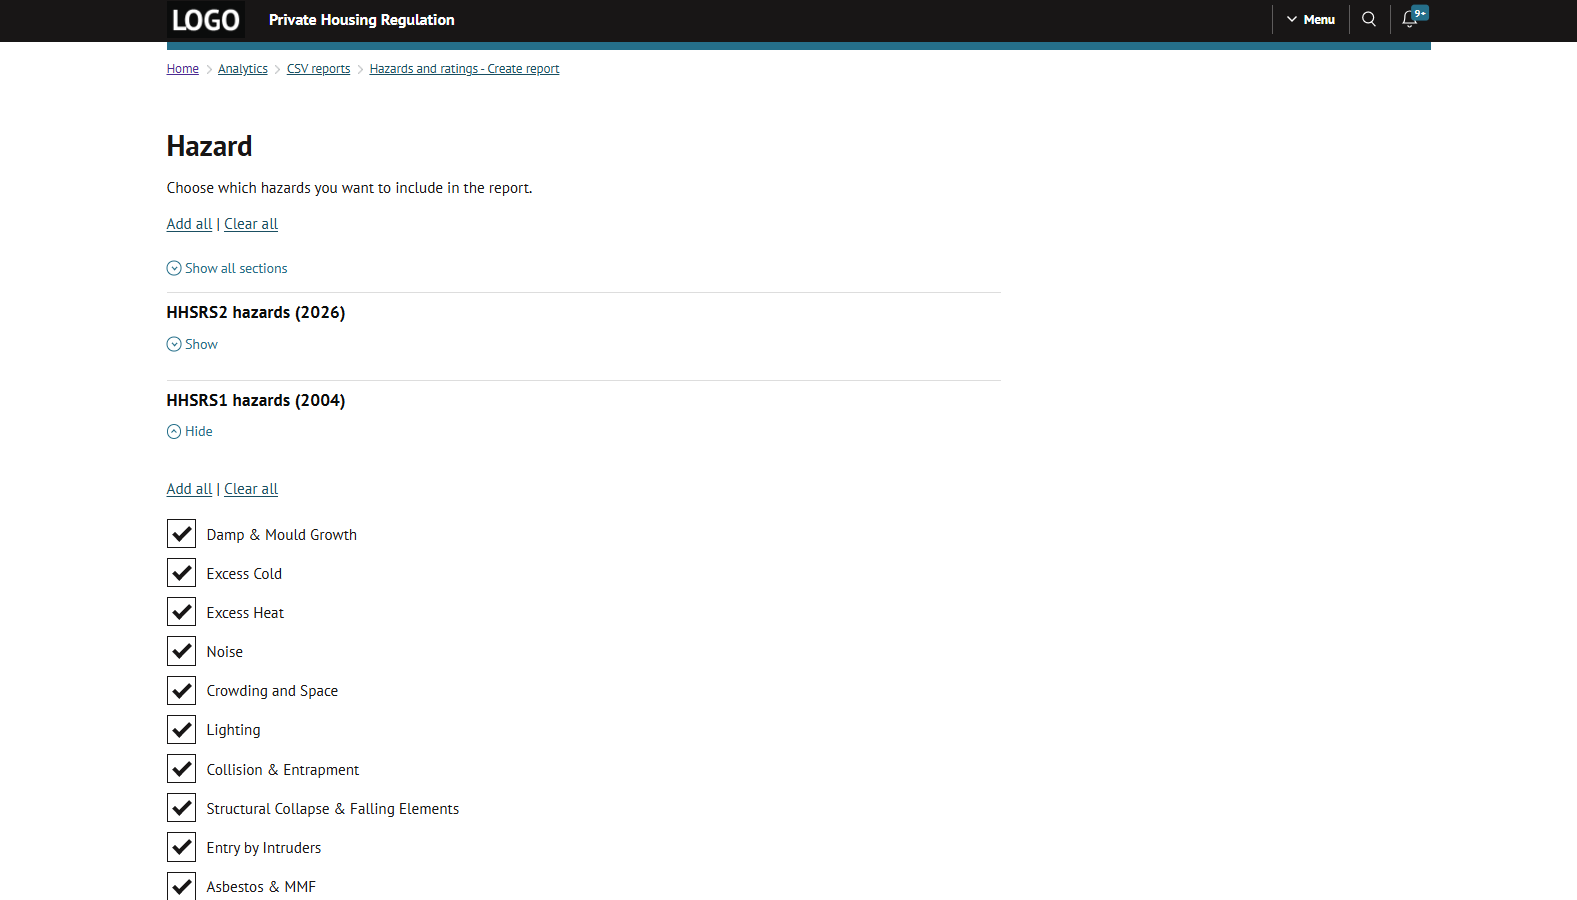
Each section has its own 'Add all' and 'Clear all' links, which affect only the hazards in that section. The 'Add all' and 'Clear all' links at the top of the page still apply to both sections at once. As before, everything is selected by default.
The split is there because several hazard names appear in both sets. Keeping them apart means you can see which version you are choosing.
The Hazard rating filter
The rating filter is split the same way:
HHSRS2 offers Low, Medium and High HHSRS1 offers A to J
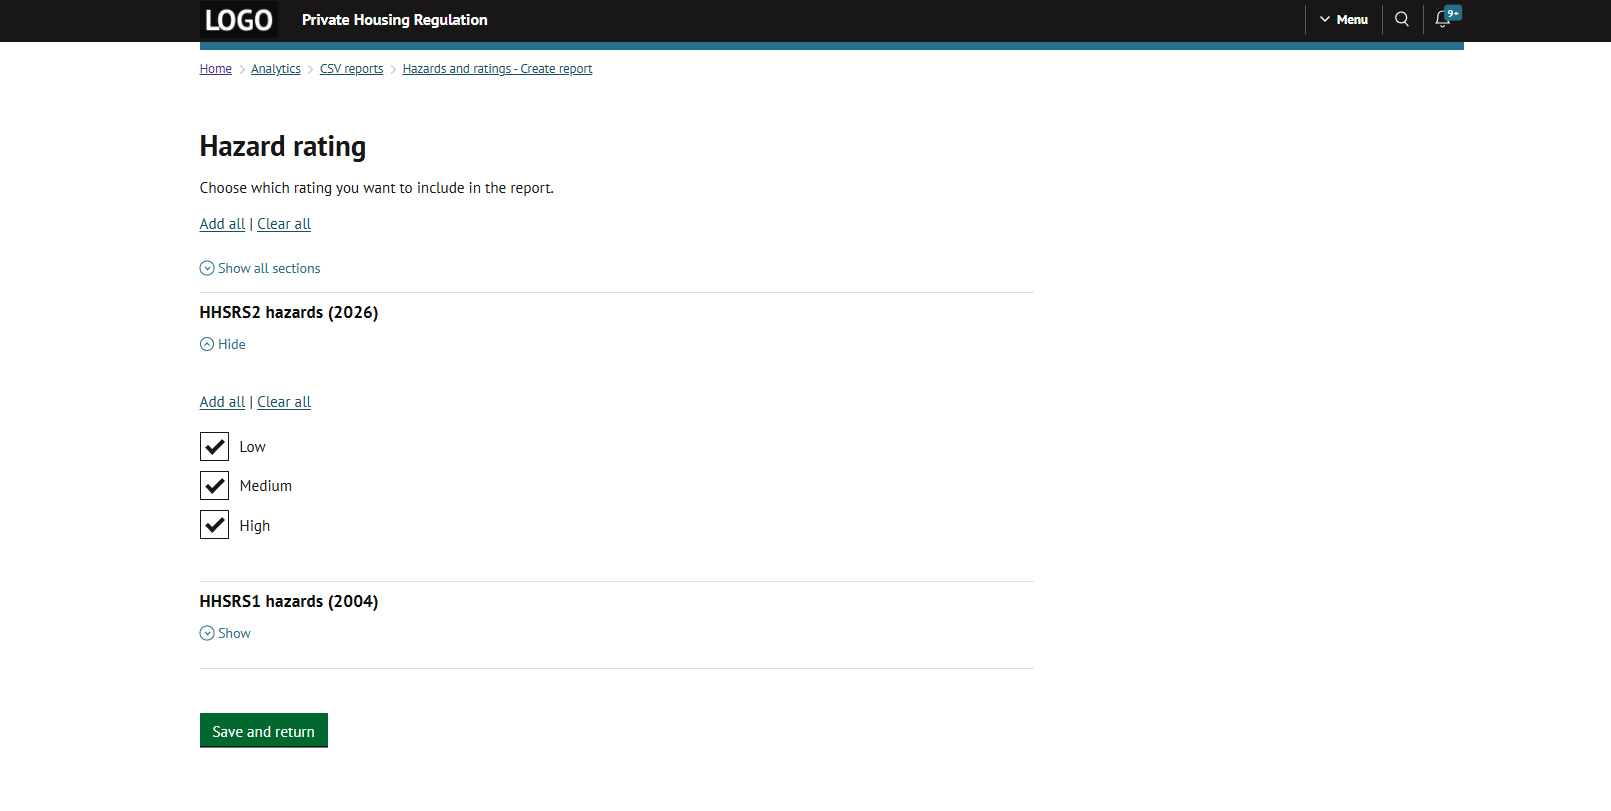
The 'None' option has been removed. To include hazards that have not been rated, clear the filter and leave nothing selected.
New columns
Two columns have been added to the report:
HHSRS version shows 2004 for a legacy row and 2026 for an HHSRS2 row. Use this to tell apart two rows with the same hazard name. Risk band shows the HHSRS2 band. The existing rating column is unchanged and still carries the A to J value for legacy rows.
10. What has not changed
It is worth being clear about what this reform does not touch:
The shape of the assessment. You still record likelihood and harm outcome, and the system still works out the score, band and category. The calculation. The same engine and the same class weightings. Category 1 and Category 2, which keep their meaning. The landlord's journey, which is the same as before. Your legacy inspections, which keep working exactly as they do today. Everything outside the hazard module.
Was this article helpful?
That’s Great!
Thank you for your feedback
Sorry! We couldn't be helpful
Thank you for your feedback
Feedback sent
We appreciate your effort and will try to fix the article